Glawe
Glawe is a cloud monitoring platform for large factories. Sensors collect machine activity, while plant teams add planned downtime and repair data. The platform calculates OEE, utilization, cycle time, and downtime for each shift, workshop, and machine.
Problem
Flatly is a Figma plugin that turns all layers inside a frame or component into a single image fill. It lets designers choose the output scale and decide what happens to the original layers.
Solution
Flatly is a Figma plugin that turns all layers inside a frame or component into a single image fill. It lets designers choose the output scale and decide what happens to the original layers.
Monitoring dashboard
Flatly is a Figma plugin that turns all layers inside a frame or component into a single image fill. It lets designers choose the output scale and decide what happens to the original layers.
Monitoring dashboard screen
Machine list
Flatly is a Figma plugin that turns all layers inside a frame or component into a single image fill. It lets designers choose the output scale and decide what happens to the original layers.
Machine list screen
Repair requests
Flatly is a Figma plugin that turns all layers inside a frame or component into a single image fill. It lets designers choose the output scale and decide what happens to the original layers.
Repair requests screen
Result
Glawe consolidated more than 10 production metrics across the plant, workshop, and machine levels. Managers could compare current performance with weekly and monthly data in one system. Machine utilization increased by 18%, energy consumption per operating hour fell by 12%, and unplanned downtime decreased by 24%. The average repair response time fell by 30%, while daily reporting time dropped from 90 minutes to 20 minutes.
Glawe
Glawe is a cloud monitoring platform for large factories. Sensors collect machine activity, while plant teams add planned downtime and repair data. The platform calculates OEE, utilization, cycle time, and downtime for each shift, workshop, and machine.
Problem
Flatly is a Figma plugin that turns all layers inside a frame or component into a single image fill. It lets designers choose the output scale and decide what happens to the original layers.
Solution
Flatly is a Figma plugin that turns all layers inside a frame or component into a single image fill. It lets designers choose the output scale and decide what happens to the original layers.
Monitoring dashboard
Flatly is a Figma plugin that turns all layers inside a frame or component into a single image fill. It lets designers choose the output scale and decide what happens to the original layers.
Monitoring dashboard screen
Machine list
Flatly is a Figma plugin that turns all layers inside a frame or component into a single image fill. It lets designers choose the output scale and decide what happens to the original layers.
Machine list screen
Repair requests
Flatly is a Figma plugin that turns all layers inside a frame or component into a single image fill. It lets designers choose the output scale and decide what happens to the original layers.
Repair requests screen
Result
Glawe consolidated more than 10 production metrics across the plant, workshop, and machine levels. Managers could compare current performance with weekly and monthly data in one system. Machine utilization increased by 18%, energy consumption per operating hour fell by 12%, and unplanned downtime decreased by 24%. The average repair response time fell by 30%, while daily reporting time dropped from 90 minutes to 20 minutes.
Glawe
Glawe is a cloud monitoring platform for large factories. Sensors collect machine activity, while plant teams add planned downtime and repair data. The platform calculates OEE, utilization, cycle time, and downtime for each shift, workshop, and machine.
Problem
Plant managers needed to see where production time was being lost and why. Supervisors needed to find idle machines quickly, while maintenance teams had to track repairs. Workers on the shop floor also needed access to machine statuses away from desktop workstations. More than 30 interviews and on-site tests helped define what each role needed from the platform.
Solution
Glawe connects sensor readings, production plans, and maintenance work in one system. It compares planned stops with actual machine activity and shows changes across selected periods. Workers can also check machine operating statuses from tablets on the shop floor.
Monitoring dashboard
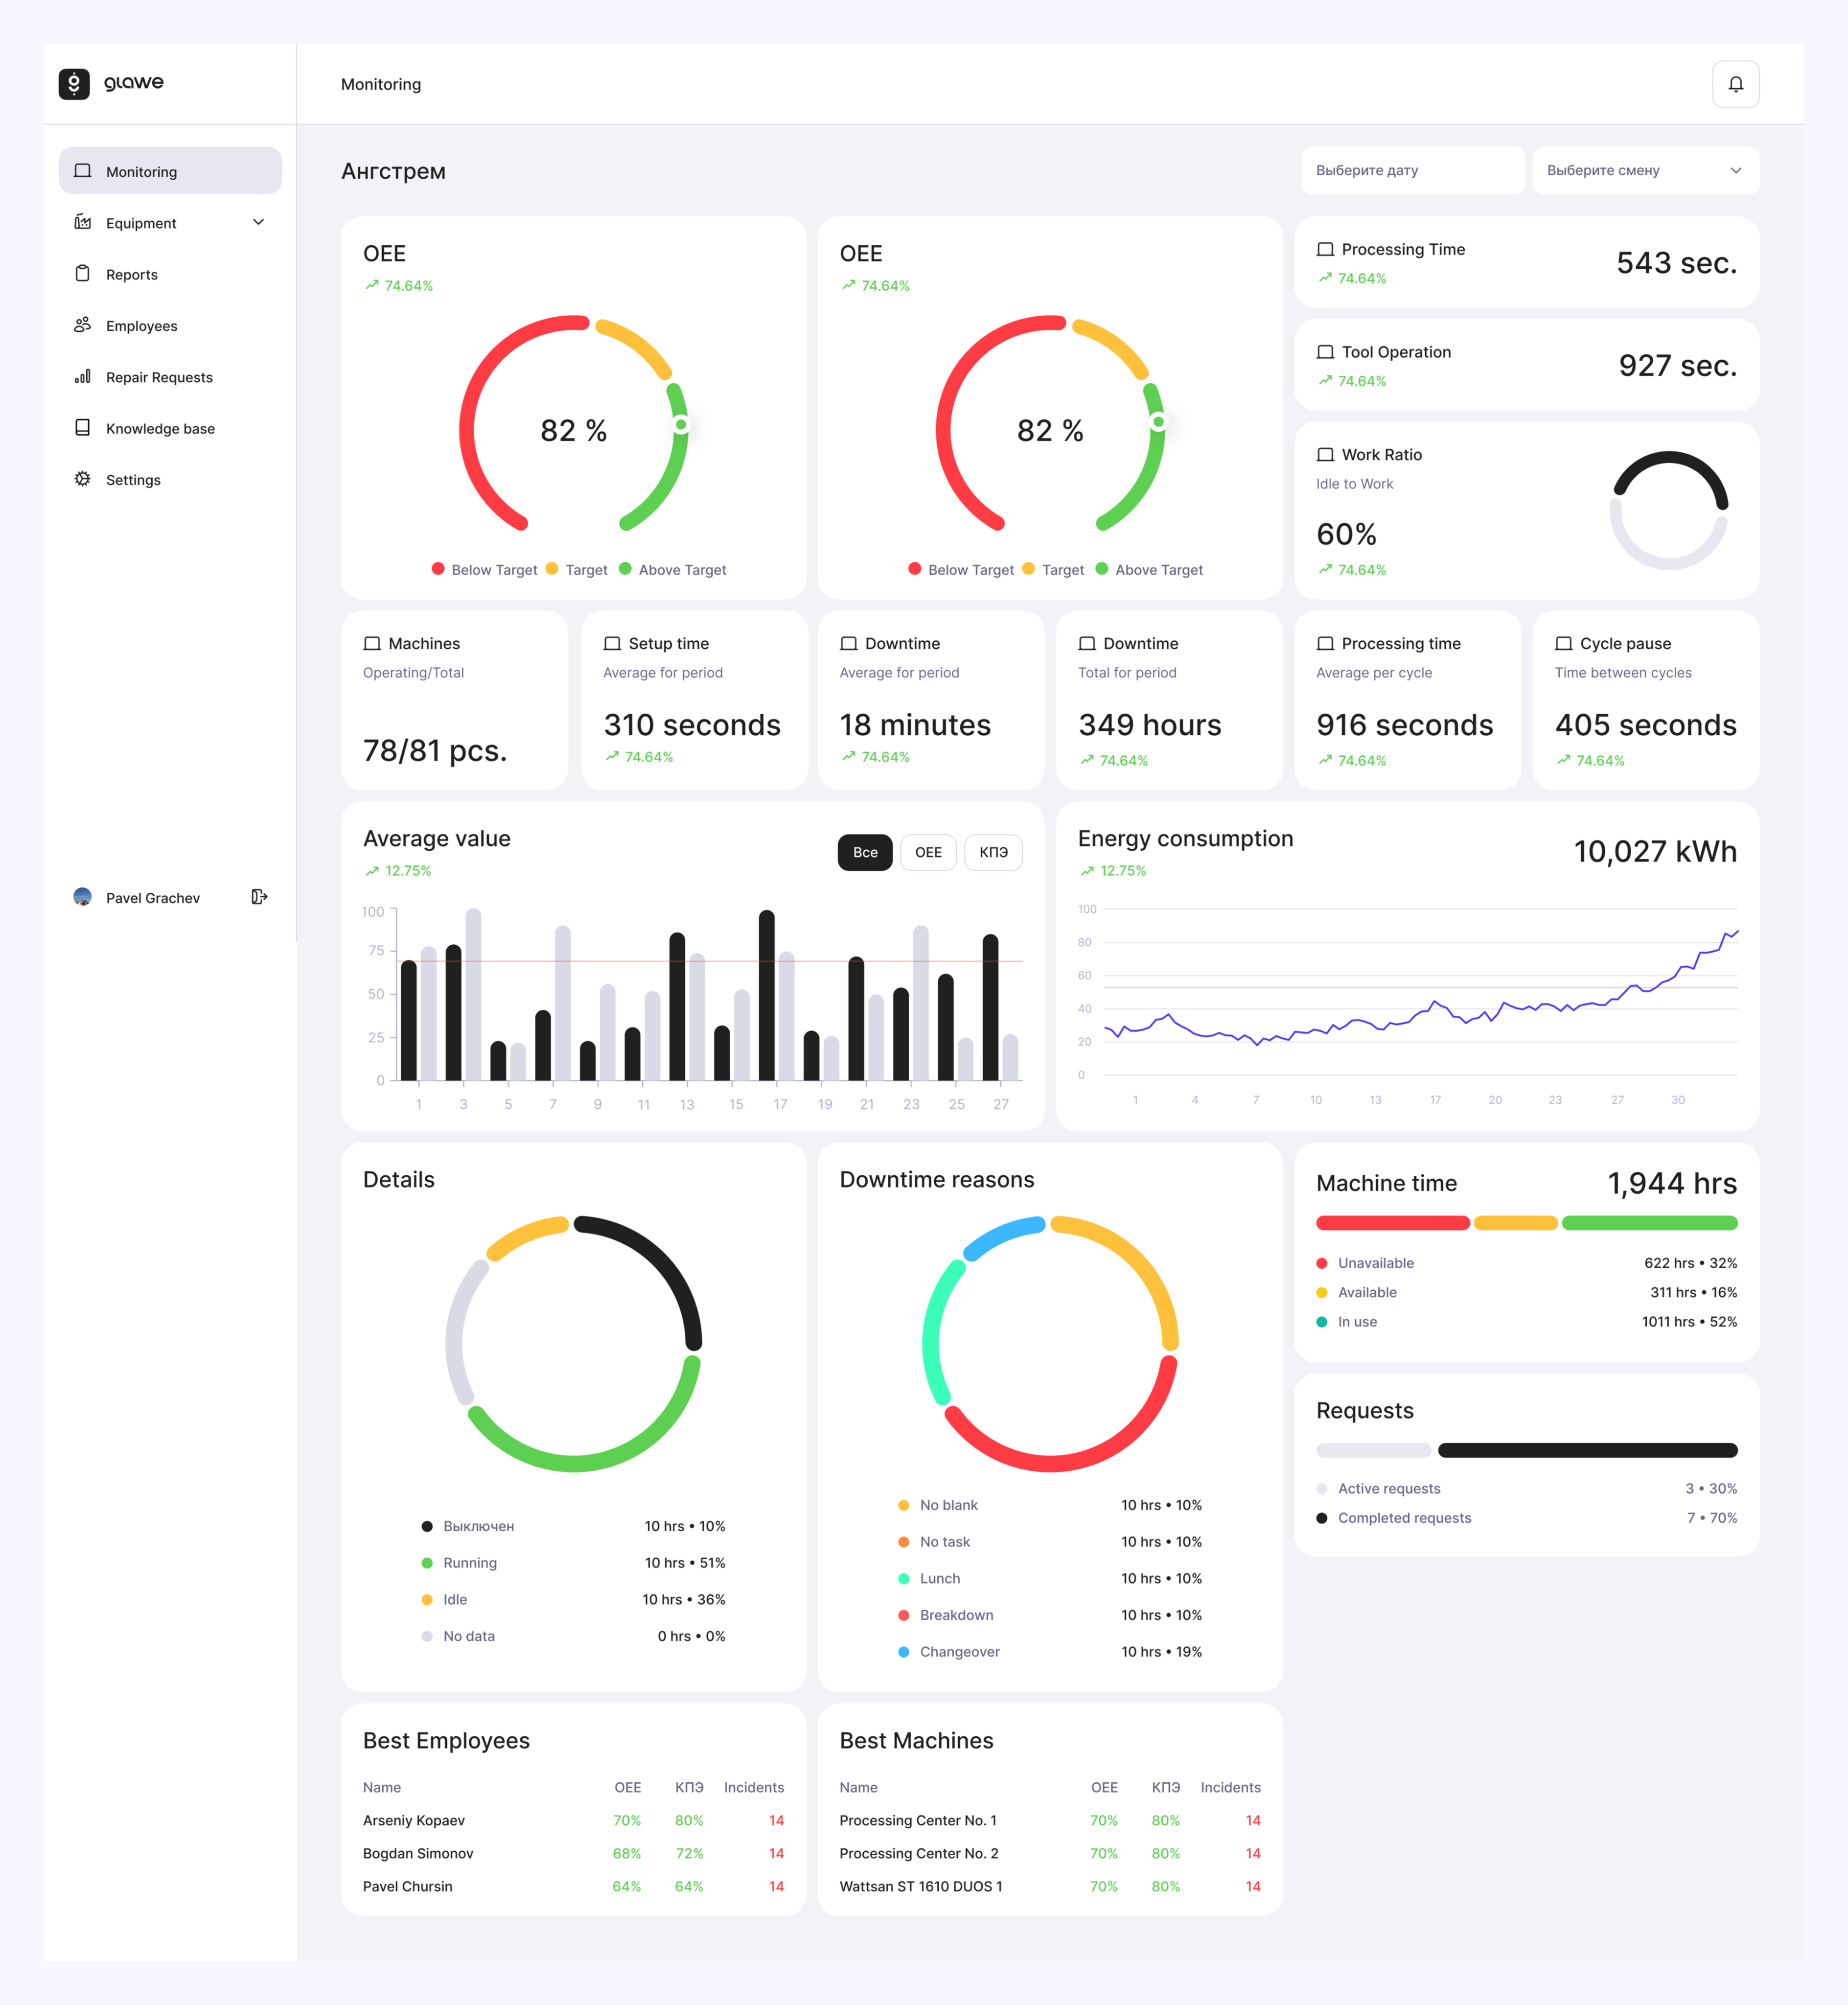
The dashboard shows the selected plant, date, and shift. Managers can review OEE, machine availability, processing time, downtime, energy use, and repair status. Charts explain changes and the causes of lost production time. This reduces the time spent preparing reports and helps managers notice problems earlier.
Monitoring dashboard screen
Machine list
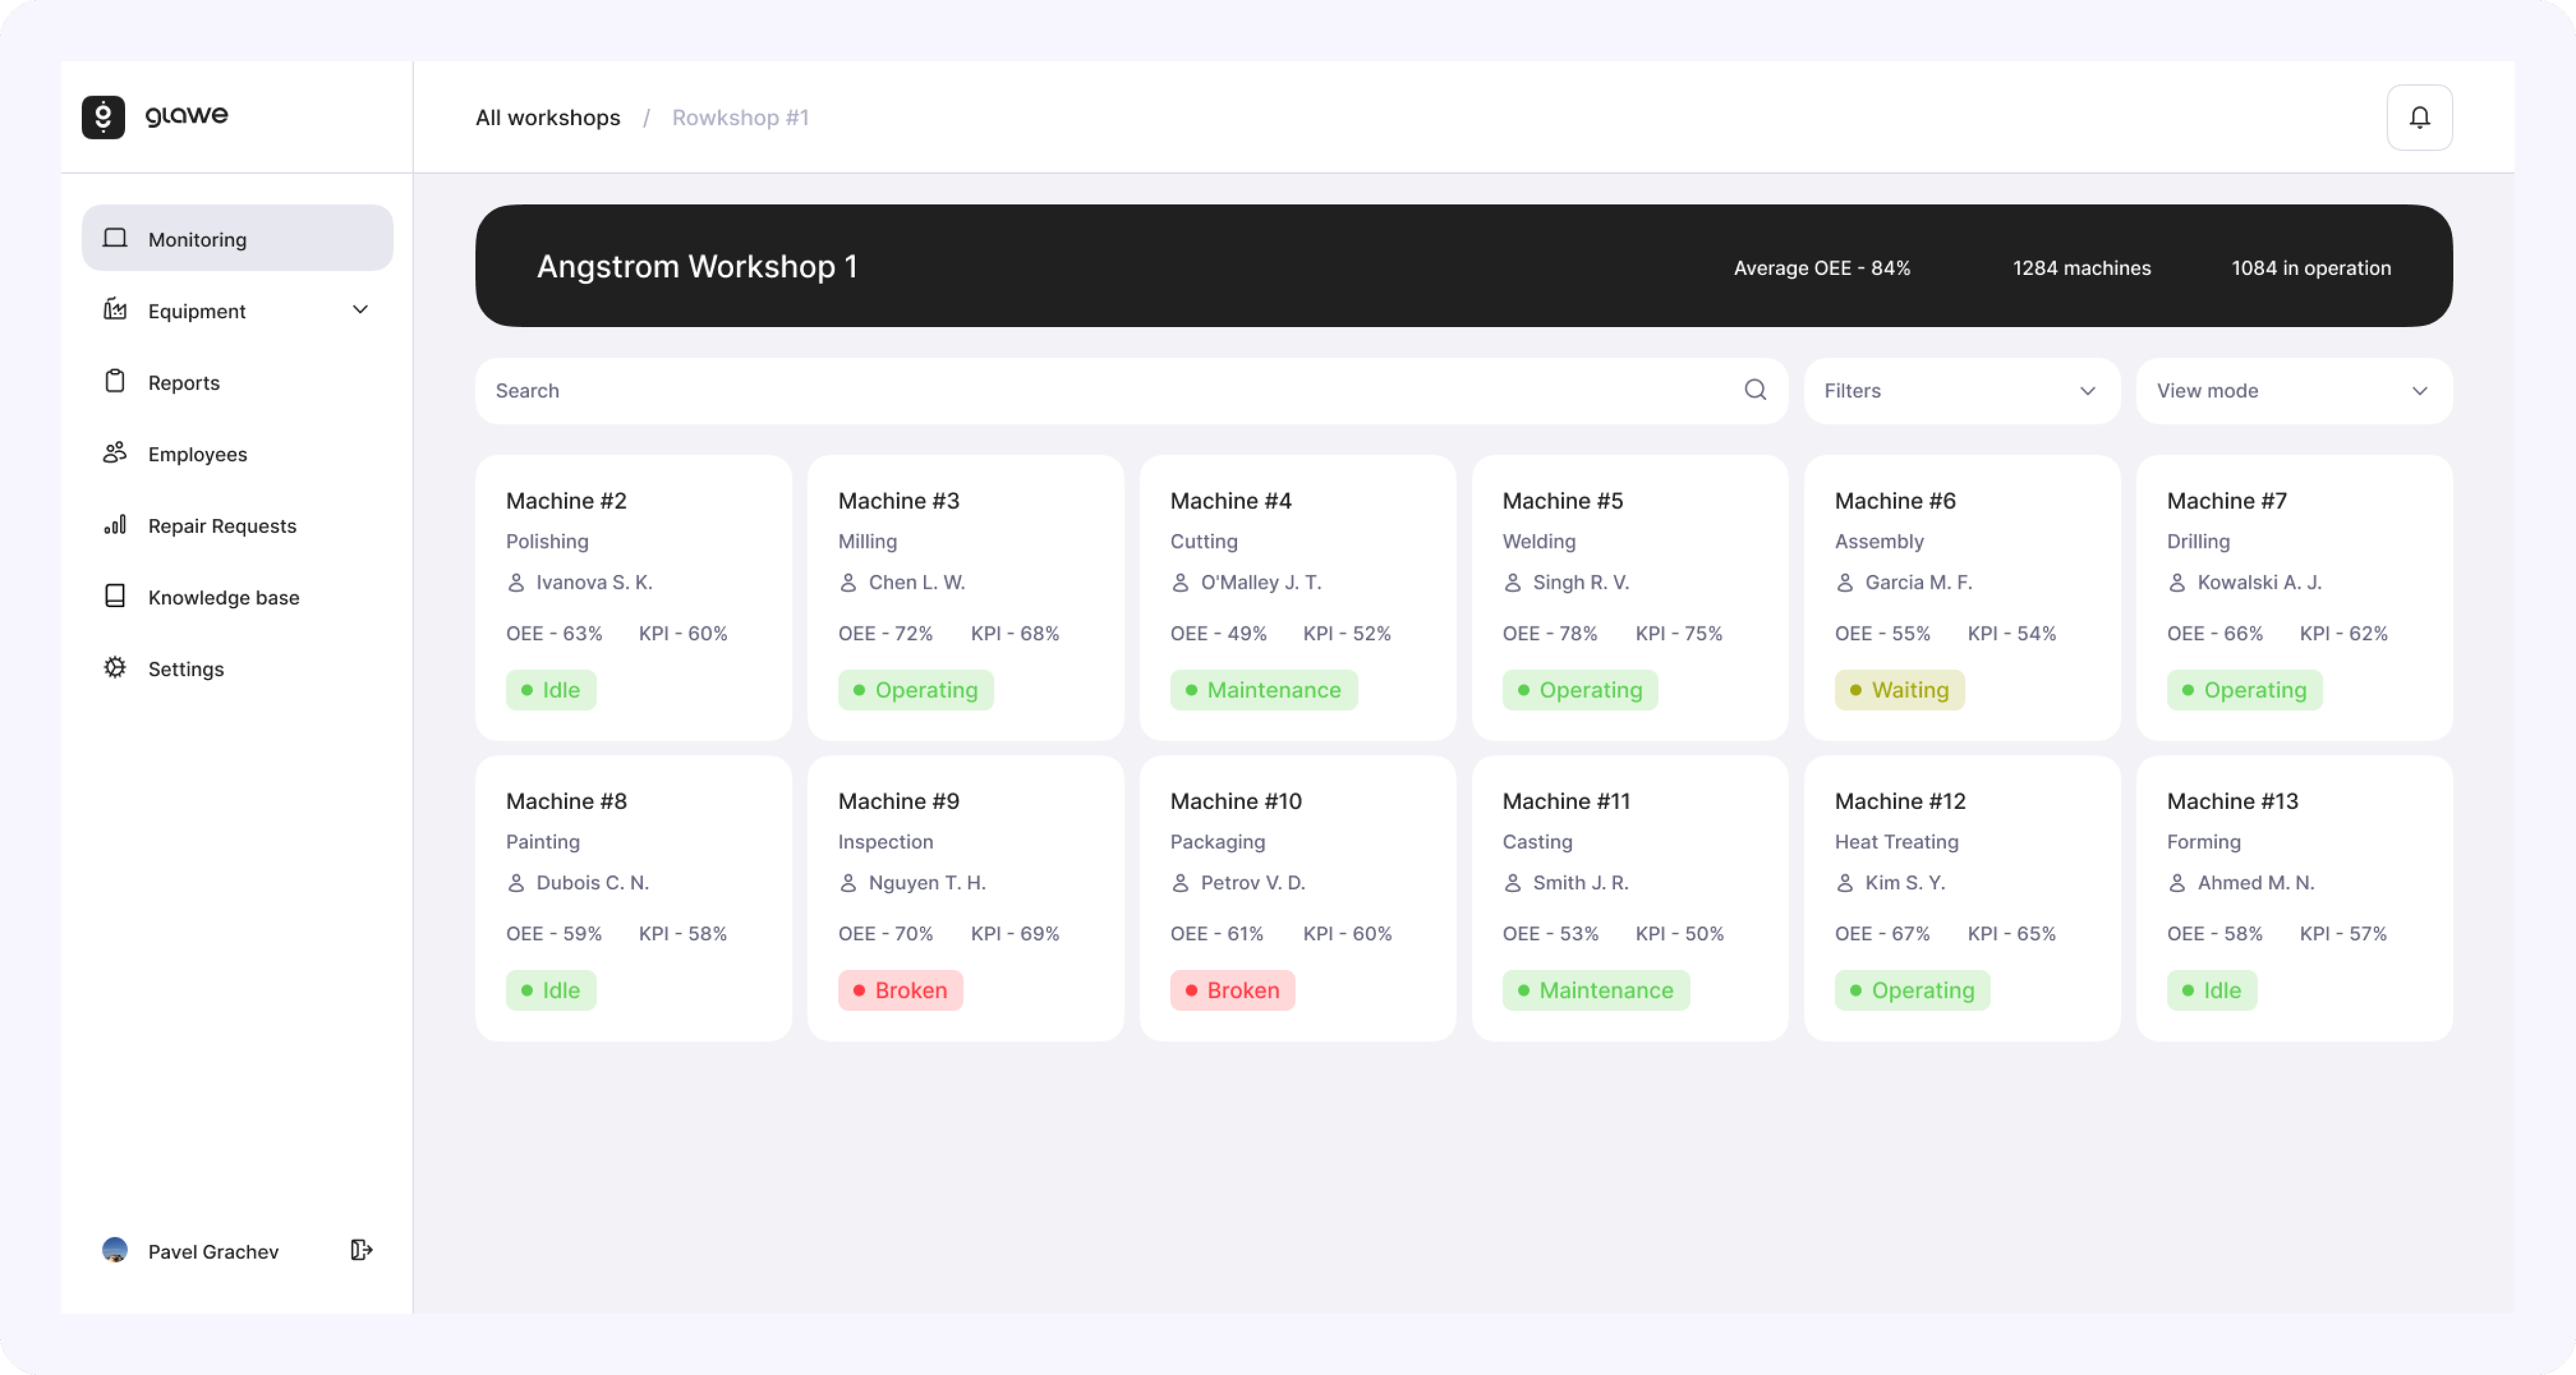
The machine list shows workshop OEE and how many machines are operating. Each card includes the machine operation, assigned employee, performance metrics, and current state. Search and filters help supervisors find machines that require attention without checking every machine separately.
Machine list screen
Repair requests
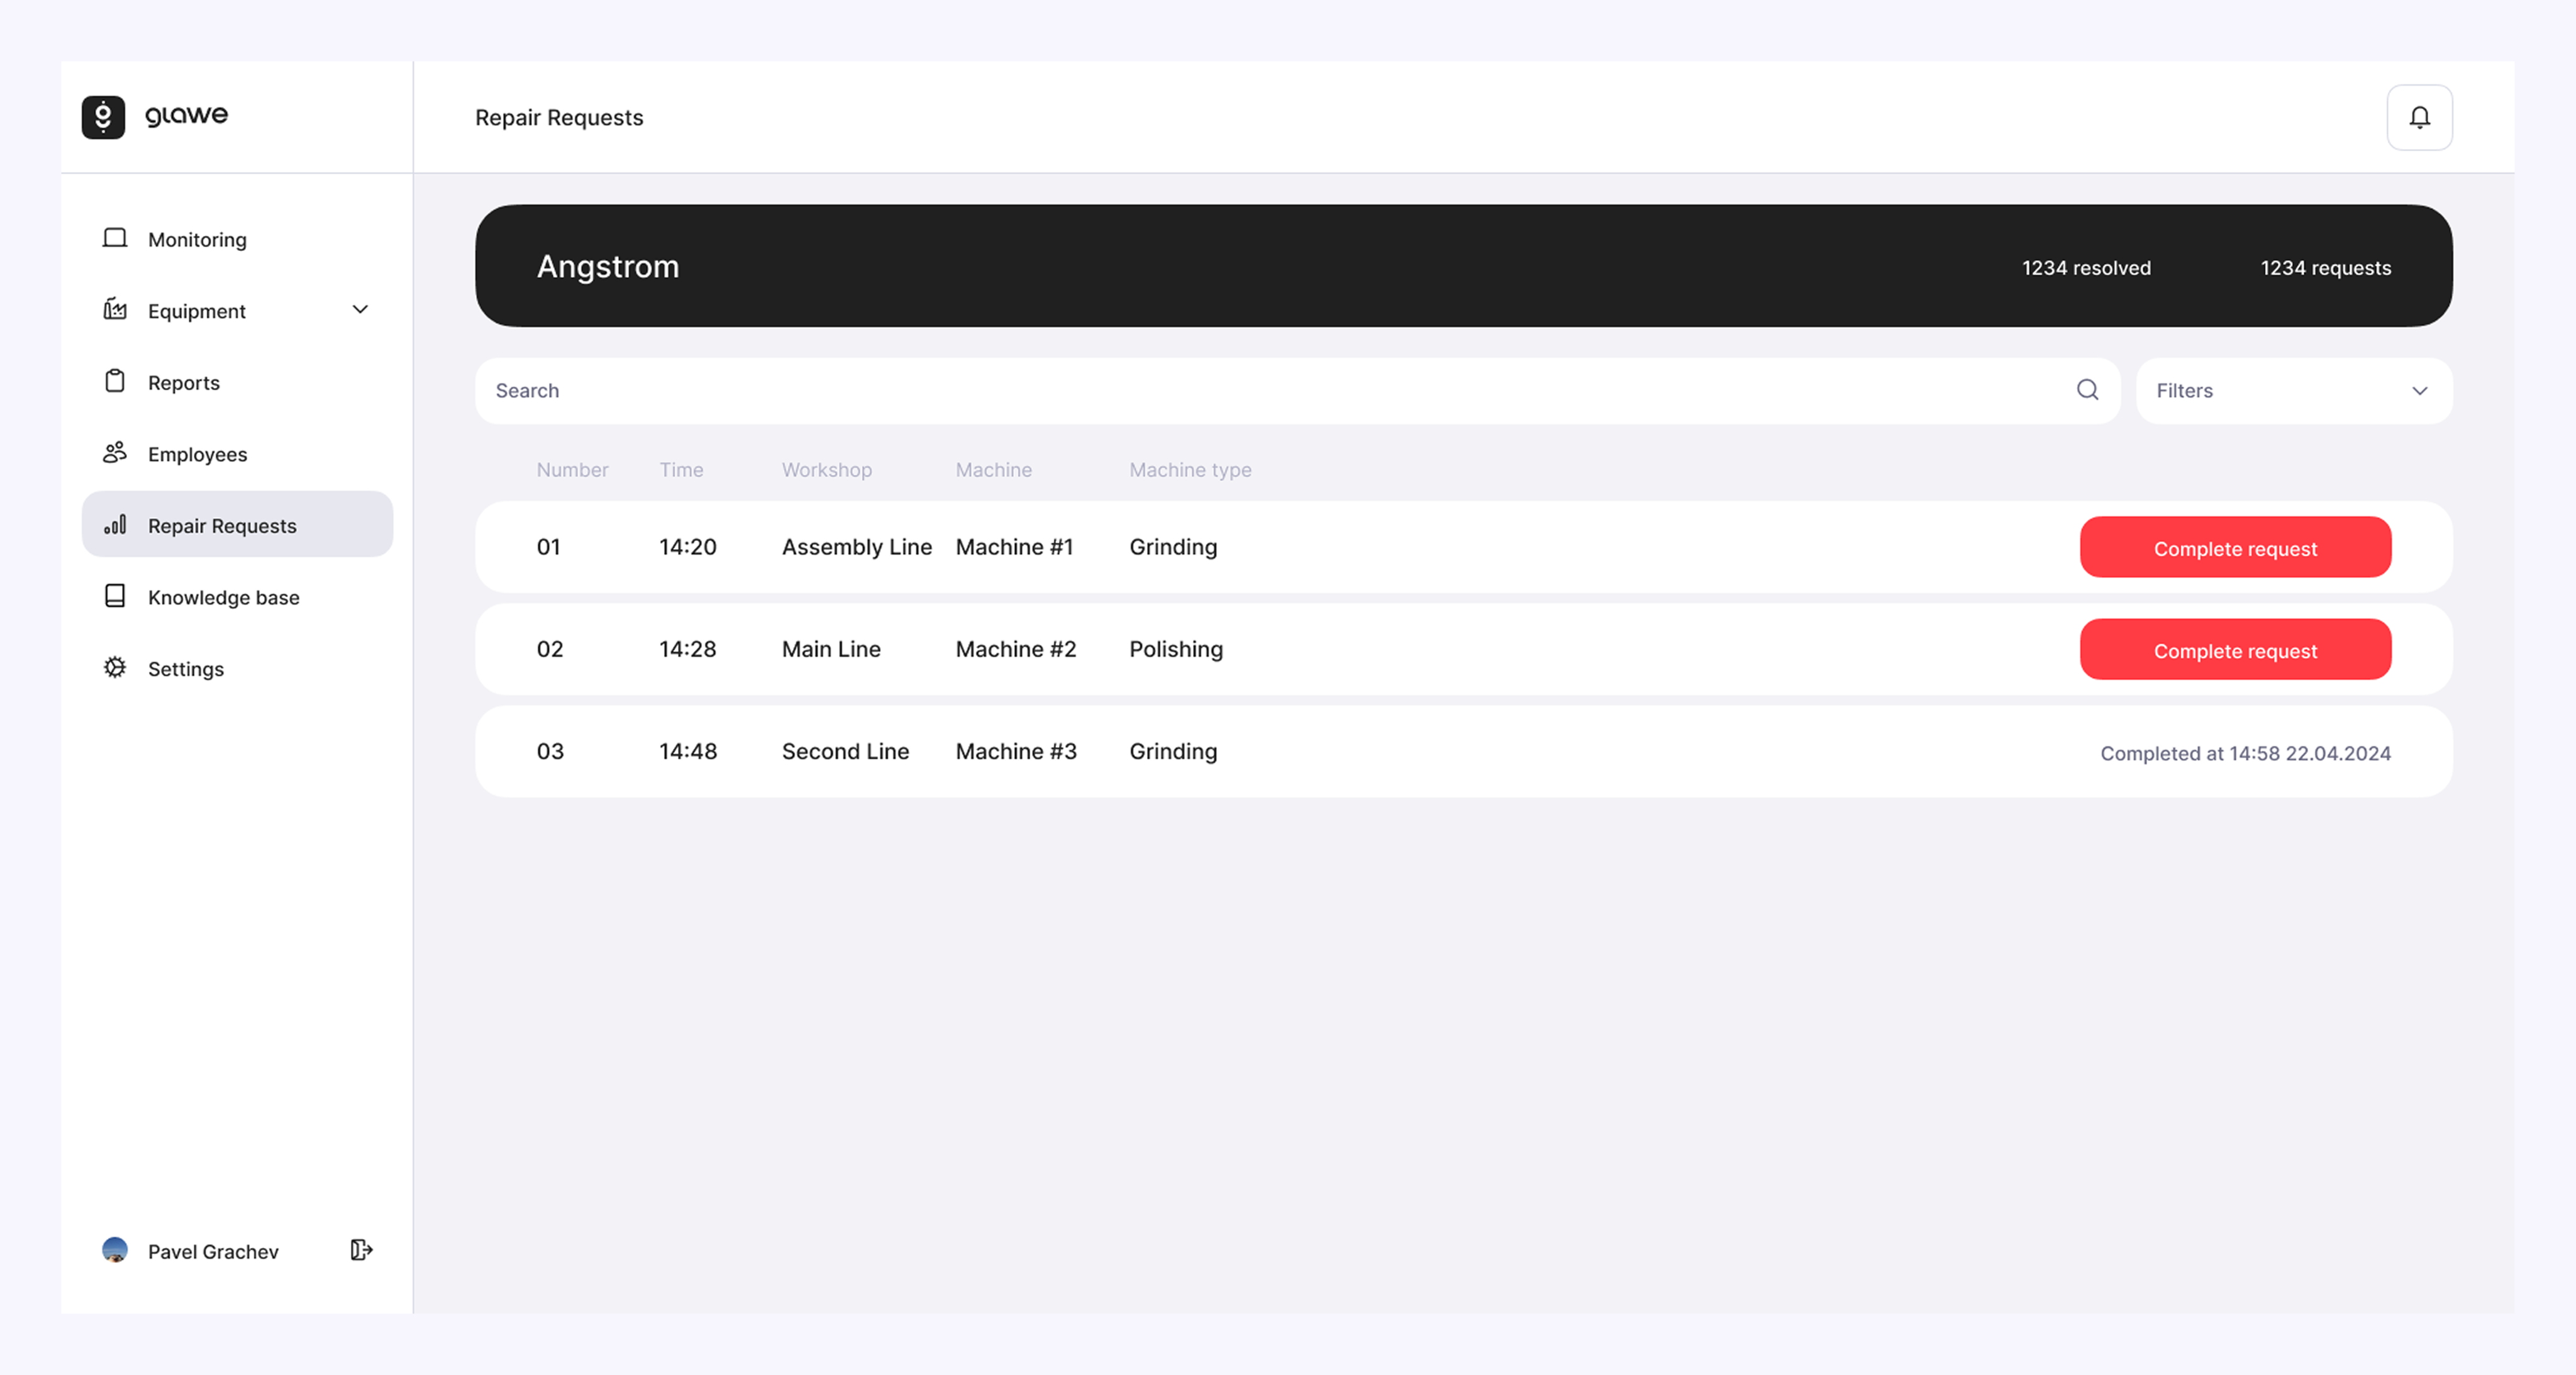
The request list shows active and completed repairs with the workshop, machine, creation time, and status. Maintenance teams can complete requests directly, while the system keeps the completion time for later review. This makes the repair workload visible and shortens the handoff between production and maintenance.
Repair requests screen
Result
Glawe consolidated more than 10 production metrics across the plant, workshop, and machine levels. Managers could compare current performance with weekly and monthly data in one system. Machine utilization increased by 18%, energy consumption per operating hour fell by 12%, and unplanned downtime decreased by 24%. The average repair response time fell by 30%, while daily reporting time dropped from 90 minutes to 20 minutes.